Fab Trade-Offs: Higher Cycle Time for Lower Cost
Choices fabs make that drive cycle times higher in the interest of reducing cost

By Jennifer Robinson
A goal in most wafer fabs is low, predictable cycle time. While there are some structural conditions in fabs that make achieving this goal difficult (high product mix, reentrant flow, time constraints), there are also choices that fab teams make that drive up cycle times. It’s been my experience that fabs regularly trade better cycle time for three things: lower costs/higher revenue, higher yields, and what we’ll call the status quo (resistance to change).
In this article, we’ll discuss the first of these: choices fabs make that drive cycle times higher in the interest of reducing cost or increasing revenue. We will cover choices regarding yield and the status quo in later issues. I’m sure those of you who have worked in wafer fabs will have suggestions to supplement this discussion. Feel free to reach out to me with your contributions.


Seven things that fabs do to reduce costs and/or increase revenue that can be counterproductive for cycle time
Seven examples are included below of choices fabs make in the interest of cost reduction that may have a detrimental impact on cycle time. We’ll discuss the likely outcome of each choice and suggest ideas for mitigating those impacts.
Of course, not all fabs do all of these things. But I think most readers will find at least a few of these familiar. These are all behaviors that I’ve heard about over the years from people who work in fabs.
1. Eliminate Buffer Capacity: To cut costs, management pushes for the elimination of standby time on as many tool groups as possible or directs capacity planners to plan for 100% utilization on the various tools.
- Likely outcome: Higher utilization on tools leads to higher cycle time for lots processed on those tools. See The Three Fundamental Drivers of Wafer Fab Cycle Time (Issue 6.05 or 22.04), Resolving the Cycle Time vs. Utilization Conflict (Issue 7.06) or our webinar on this subject (scroll to bottom of page) for more details. When tools are pushed near 100% utilization over the longer term, cycle time and WIP can build to unsustainable levels.
- What you can do: Share the above resources to help your management team understand the reasons why a capacity buffer helps keep cycle times from getting out of control. If general articles are not sufficient, pull some per-visit cycle time data for your highest utilization tools and show how high the queue times are relative to other, lower utilization tools. Trend charts for key tools can show how short-term cycle time increases with utilization.
- As an example, the chart below shows E10 tool state data by tool group, sorted in descending order by standby-no-WIP time (the light gray bars) for our FabTime demo server. Note the gray marked line showing WIP (which we know from Little’s Law correlates with cycle time). WIP is highest for the tool groups with limited standby time, and drops significantly for the other tool groups, which all have more of a standby time buffer.
 is highest when there is low standby time.")
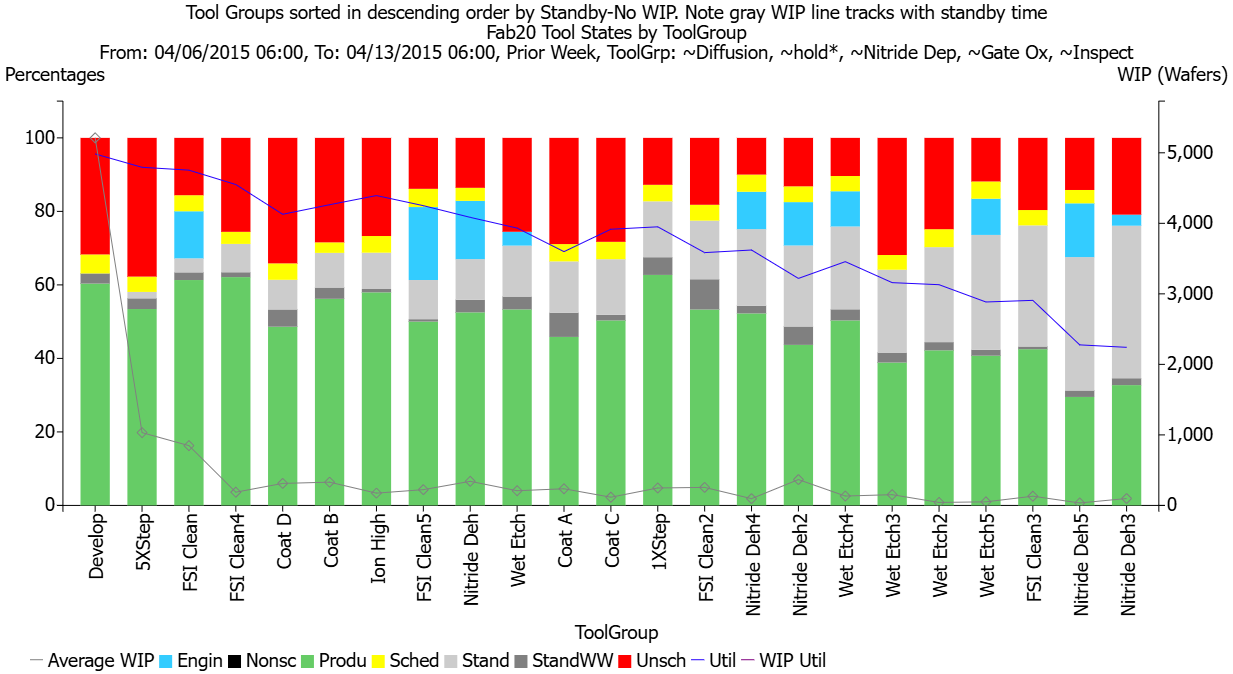
- There are also things that you can do to increase the standby time buffer on tools by reducing standby-WIP-waiting time, improving equipment uptime, and scheduling engineering time more efficiently. See A New Metric for the Functional Utilization that Drives Cycle Time (Issue 25.05) for more details.
2. Soft Idle Tools: To reduce variable costs (electricity, consumables, maintenance) during a slow period, management directs the team to “soft idle” certain tools and thus run with higher utilization on the ones that remain. Typically, these tools are placed into a non-scheduled state (though there is some debate about that), where they may be re-activated following qualification if needed.
- Likely outcome: In addition to the impacts from higher utilization (see above) on the remaining tools, idling tools leads to smaller tool groups. Where this results in groups with fewer than three qualified tools (especially where it results in only one qualified tool), expect cycle time per visit to be 25-100% higher than it would be otherwise. See Managing One-of-a-Kind Tools (Issue 23.05) or The Impact of Tool Qualification on Cycle Time (Issue 20.05).
- The graphic below shows estimated cycle time per visit for tool groups with different levels of redundancy (90% utilization in all cases, and moderate variability). Soft idling one of 10 tools to go to nine won’t have much impact, but soft idling one of two tools to go down to one will double the per-visit cycle time.
- What you can do: Push back where “soft idling” results in one-of-a-kind tools or tool groups with very little standby time. Where possible, keep the soft idled tools up to date on major PMs, so that they can be brought back online relatively quickly if an issue arises with one of the remaining tools.


3. Run Too Many Hot Lots: To meet demands for key customers in the face of high overall cycle time, the production control team requests ever-increasing numbers of hot lots. This behavior tends to be aimed more at increasing revenue than decreasing costs.
- Likely outcome: Higher variability from the hot lots (especially when they are hand carry lots) may drive average cycle time higher, resulting in the need for even more hot lots to satisfy customers. A vicious cycle will ensue.
- What you can do: Push back by measuring the impact of the hot lots on the cycle time of regular lots and (if you are in a vicious cycle) show how this is increasing. See Issue 25.01 for a description of a metric to capture this, which is now available in our FabTime reporting module. See also Cycle Time and Hot Lots: Updated (Issue 19.03), available in PDF from our FabTime Newsletter Archive.
4. Reduce Spare Parts and Service Contracts: To reduce costs, the equipment engineering department cuts back on spare parts and lets service contracts lapse, and/or cuts back on the number of in-house maintenance techs.
- Likely outcome: Longer periods of unscheduled downtime will be observed while waiting for parts or outside service technicians. Similar delays may come from waiting while the in-house maintenance tech is busy somewhere else. Longer downtimes, especially on one-of-a-kind tools, are well-known to contribute to longer cycle times. See Improve Fab Cycle Time by Tracking the Right Equipment Reliability Metrics (Issue 25.04) for more details.
- What you can do: Track your unscheduled downtimes by detailed sub-states (like INFICON’s Enhanced Tool Performance states) and look for time spent waiting for parts or waiting for a service technician. Observe where this correlates with high cycle time per visit. Hint: this will be most obvious on one-of-a-kind tools. Use the worst instances of long unscheduled downtimes on smaller tool groups to guide potential changes. This can be an instance where the financial benefits of keeping key tools running clearly outweighs cost savings on the maintenance side, but you’ll need to gather sufficient data to show this.
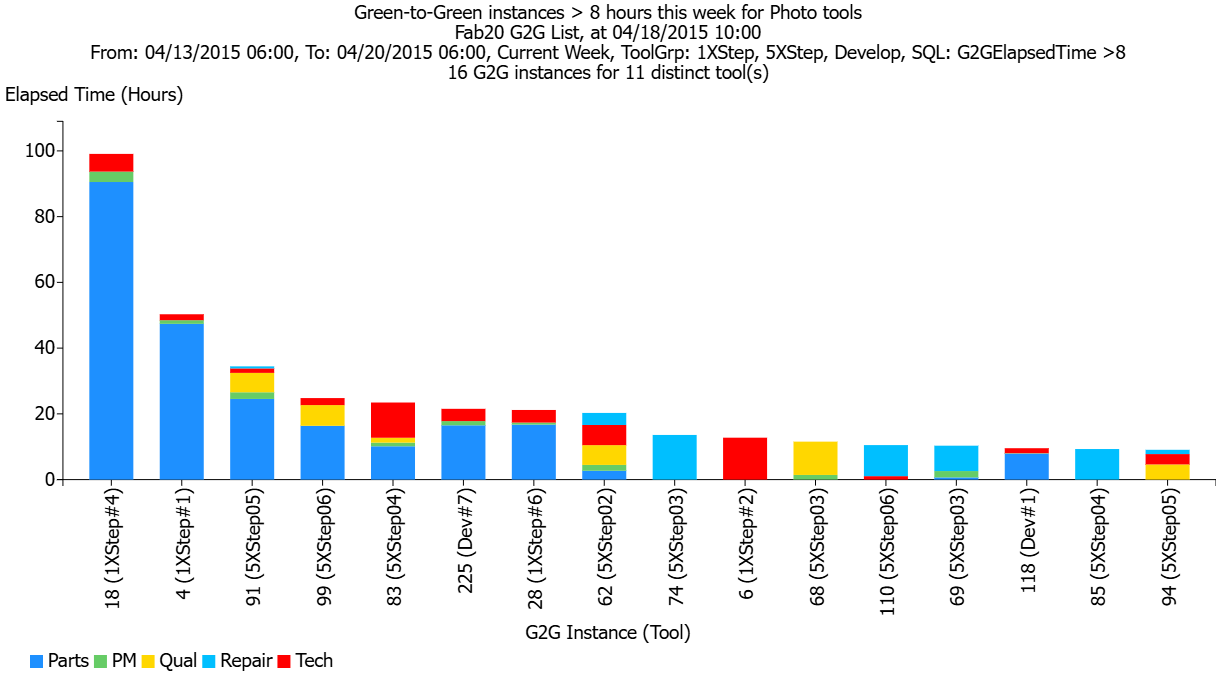
- As an example, the chart below shows green-to-green instances longer than 8 hours for a collection of photo tools. The medium blue color is “waiting for parts.” The red color is “waiting for tech.” If these waiting states correspond to poor cycle time for the associated tools, changes might be needed. In this case (from our demo server), the 1x Steppers have extra redundancy, so the delays are probably not critical.
 and for technicians (red).")
5. Maintain an Insufficient Number of Operators: To control costs, the production team either fails to cross-train operators or doesn’t hire enough operators, such that (especially when anyone is out sick) operators end up constraining key tools in the fab.
- Likely outcome: Because operators can’t be in more than one place at one time, even bottleneck tools may spend time in a standby-WIP-waiting state. This is lost effective capacity that results in lower fab throughput and/or higher cycle times. Also (for manual fabs), because operators are overloaded, they may wait to fill carts before transferring lots between steps. This adds arrival variability to downstream steps, further increasing cycle time.
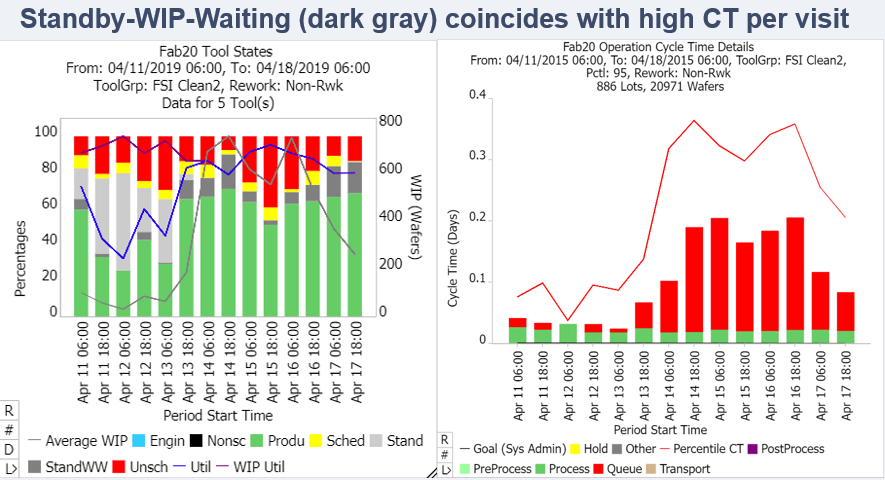
- What you can do: Collect data on tool groups where standby-WIP-waiting time corresponds to higher per-visit cycle time or missed throughput. Reassign or recommend cross-training for operators where possible. If arrival variability due to full carts is an issue, consider a one-time investment in smaller carts, or implement policies to restrict the number of lots loaded onto any cart. An example of high standby-WIP-waiting corresponding to high cycle time per visit for a tool group is shown below. See A New Metric for the Functional Utilization that Drives Cycle Time (Issue 25.05) for more details.

6. Run Full Batches on Lightly Loaded Tools: To reduce consumables costs, production management directs operators to run (nearly) full batches on all batch tools, including lightly loaded tools.
- Likely outcome: For tools that are not heavily loaded, average queue time per visit can increase significantly when lots wait to form batches, as shown in the left-hand side of the image below. Arrival variability downstream of the batch tools also increases, spreading cycle time problems out through the fab. See Batch Loading Policies for Wafer Fabs (Issue 9.03) or 10 Recommendations for Fab Cycle Time Improvement (Issue 22.02), item four.
- What you can do: Where consumables costs are a significant factor (e.g. a gold process), it may be necessary to run full batches. In this case, it’s best to start lots that can be batched together in groups and keep them together as much as possible throughout the process flow. Fabs should bear in mind, however, that running full batches in a low utilization environment can dramatically increase fab cycle time. Where possible, the most lightly loaded tools should be run using a “greedy” policy, whereby the tool is started whenever any lots are waiting. Alternatively, fabs should try scaling back the required batch size and observe the result. This may be another instance where the cost saving from running fewer batches is not worth the cost in higher cycle time.


7. Defer Investments to Make the Fab Smarter: To keep costs down, fab management resists software investments that might make the fab “smarter.” This could be anything from not having a formal MES to doing scheduling, dispatching and starts planning manually (or via spreadsheets). The fab likely relies on the experience of the production staff to make good decisions.
- Likely outcome: Over time, the fab may fall behind compared with competitors. As key personnel retire or change jobs, passing on knowledge will become difficult. Customers may be unhappy about poor visibility into expected shipment dates. Industrial engineers may spend time manually recording events in the fab, rather than analyzing the data and suggesting improvements.
- What you can do: Your options here depend, of course, on where you are starting from. Some of the transition nodes (like adding an MES) are big jumps, requiring a real commitment of time and money. But in many cases, there are smaller steps that you can take. You can add some sensors or FabGuard® systems to automate data collection. Even if you aren’t ready for full fab scheduling, you may be able to improve your dispatch system. Getting a Digital Twin for your factory opens up all sorts of other options by helping you to store data in a structured, accessible way. Wherever you are starting from, the team at INFICON would be more than happy to talk with you about options to make your fab a little bit smarter (or a lot smarter).
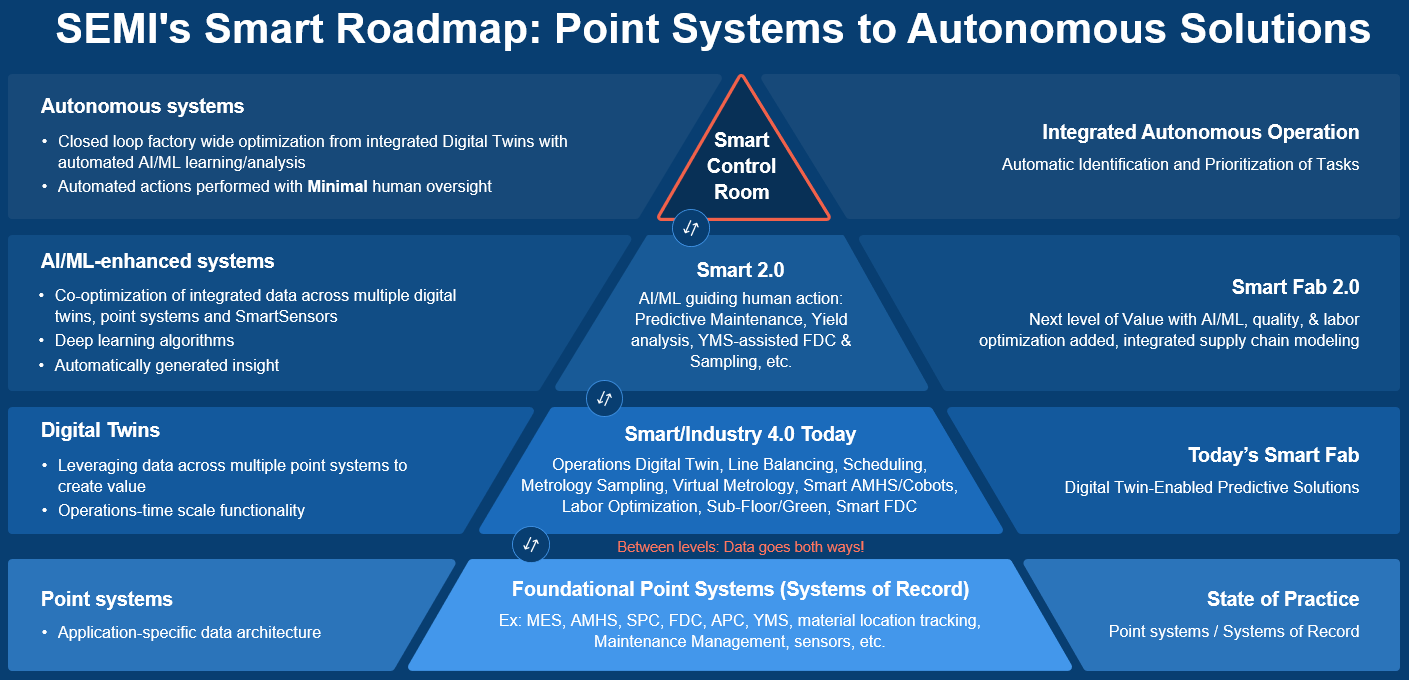
- The picture below shows the SEMI Smart Manufacturing Roadmap. Wherever your fab is on the pyramid, you can benefit from moving up, and adding more integrated, autonomous solutions.

Conclusions
We all face trade-offs every day. In a wafer fab, some of the biggest trade-offs are between cycle time and cost (particularly in times when markets are uncertain). We want good cycle time, but we also want to increase throughput, to maximize return on expensive capital investment. We want good cycle time, but we also want to reduce variable costs, including labor, consumables, and spare parts. Understanding the cost side of these decisions is straightforward. Understanding the cycle time side of the equation is more challenging.
In this article, we’ve discussed some of the impacts that these cost-driven choices have on cycle time, and suggested ways to minimize those effects. In some cases, we recommend the use of data to better quantify the trade-offs. The goal, after all, is to optimize overall company performance, balancing cost and cycle time.
Closing Questions for Subscribers
Does your fab do any of the things mentioned above? Do you have other suggestions for mitigating the detrimental effect of these choices on cycle time? What else would you add to this list? What should we discuss in the next two issues (choices, or lack thereof, regarding yield and the status quo)? Your response will be kept confidential – your name and company name will not be shared publicly.
Further Resources
All past FabTime newsletters are available in PDF format from the FabTime Newsletter Archive. Please reach out to me for the link or look in the most recent email issue of the newsletter. You can download individual issues or download a zip file containing all past issues. Some articles have been re-published on the INFICON website. Those are linked above where mentioned. See also:
- 10 Recommendations for Fab Cycle Time Improvement (Issue 22.02)
- 10 More Recommendations for Improving Fab Cycle Time (Issue 24.01)
For a more in-depth discussion of how these choices apply to your site, consider hosting a session of our four-hour web-based cycle time management course.
See also:
- Community Announcements included with this issue
- Subscriber discussion forum for Volume 26, No. 4


Want to learn more about cycle time drivers in your fab?
