FabTime®
Actionable Insights Driving Factory Improvements

Product configurator
Gemini™ MxG5xx
Actionable Insights Driving Factory Improvements
Designed for all levels of factory management, we make it possible for you to experience immediate and clear views of your fab data, all without the need for programming expertise.
Proven Results
Our cost-effective factory reporting paired with our seamless plug and play integration delivers a rapid return on investment. Prepare to expose blind spots, increase capacity, and reduce cycle times.
Our Approach

The FabTime interface comes with 165 informative, ready-to-use, interactive charts designed for fab settings. Continuously updated with the latest data, these charts offer fab management instant visibility into fab conditions and critical insights for strategic decision-making.
We integrate data collection, report logic, and visualization into a unified solution. This streamlined approach allows fab management to obtain necessary information without delays and alleviates IT and IE teams of the burden of report generation and report system maintenance.
Our team meets regularly with our individual customers, providing personalized support for unique customer projects and requirements. We also meet with our customers in our monthly user group, where their feedback directly shapes ongoing enhancements to the FabTime software.
Respond to problems before they escalate with live charts and alerts
Centralized reporting eliminates data disparities and negates individual validation
Dedicate more time to improvements rather than tracking down production issues
Real-time monitoring highlights bottlenecks so managers can take targeted actions
Removes the need to upkeep costly internal reporting infrastructure
Sophisticated charts reveal more efficient allocation of specific resources
Increased profits resulting from enhanced production efficiency
Timely reporting allows teams to quickly respond to issues
Plug and play integration with minimized disruptions to existing operations
We do the work so your teams can focus on improvements
We differ from commercial reporting tools that only offer data visualization, and still require significant investments of time, staff, and financial resources to maintain reporting. Our end-to-end-solution covers all the bases, enabling you to efficiently allocate your resources and time to more productive uses. This includes integration with the Factory Scheduler.
Retrieving data from the MES or comparable systems doesn't fall on your IT teams
Standardized chart formatting created with IE expertise and SEMI industry standards
Interactive user interface with pre-configured charts suited for various factory roles
Flexible Factory Reporting
Engage directly with your data to evaluate your facility's conditions and uncover valuable insights
- Out of the Box Insights: Ready-to-use predefined charts that refresh automatically
- Data Transparency: Gain clear views of your operations
- On Demand Reports: Access charts instantly from any device
- User-Friendly: Experience an intuitive interface that presents data to your specifications
We offer more than just generic charts. Choose from an extensive selection of over 165 configurable charts, specifically created for fab environments and designed following SEMI E10 and E79 standards.
All levels of factory management have the flexibility to customize charts and dashboards to meet their specific requirements. This direct customization eliminates reliance on IT teams to create new reports for each new set of data.
Charts instantly adapt to your personalized configurations and reflect the most recent data from your servers. These real-time visualizations allow you to work proactively to address potential challenges before they escalate.
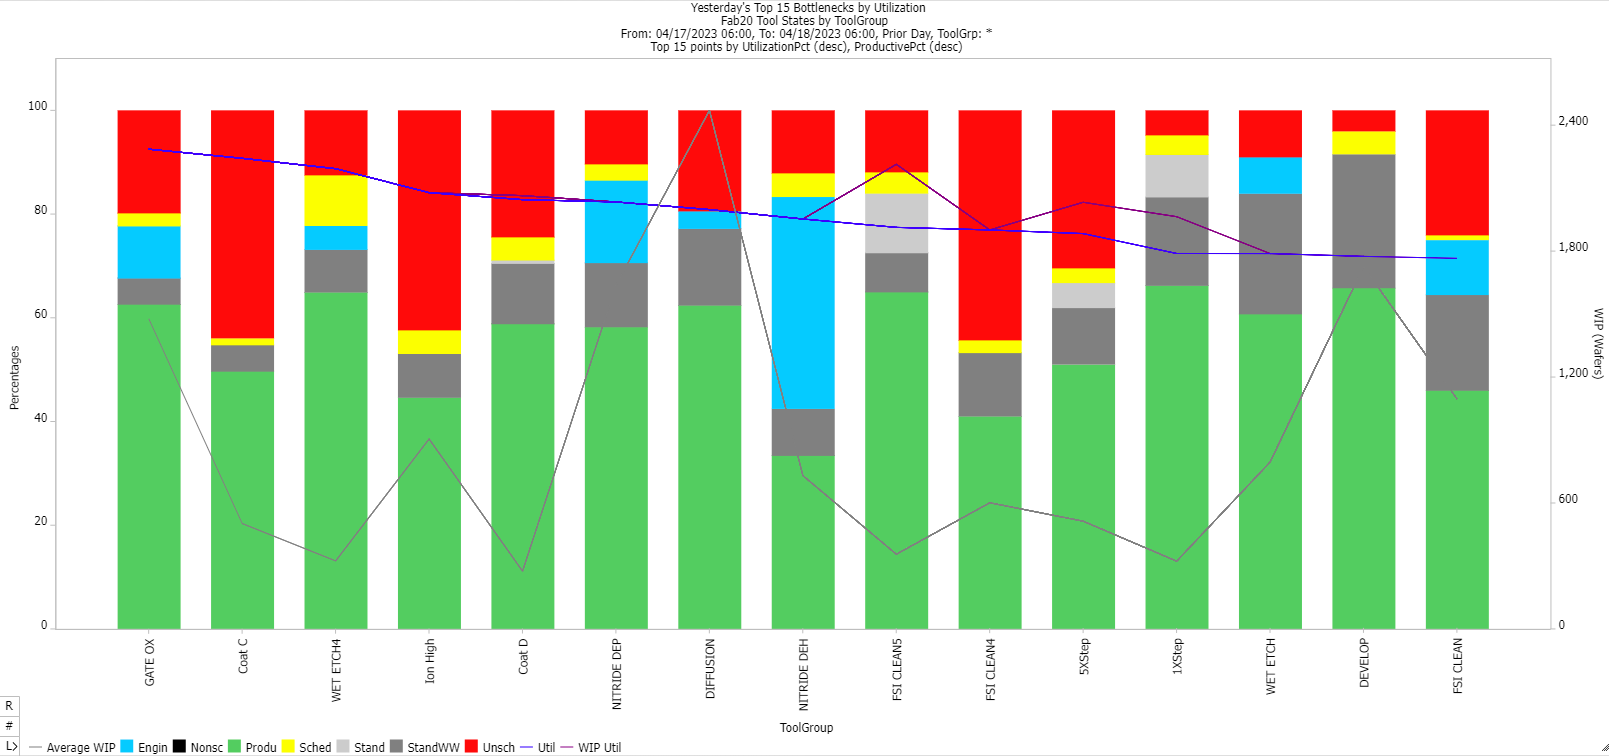
Tool State Pareto Chart
View your recent bottlenecks by using the Tool State Pareto Chart, sliced by tool group (as shown), or by tool. Your logged tool states are mapped, by site, to the SEMI E10 standard states. FabTime also breaks down tool idle time according to whether or not WIP was available that could have been run at that time. Use this chart to identify capacity bottlenecks and to understand tools that contribute to cycle time problems.

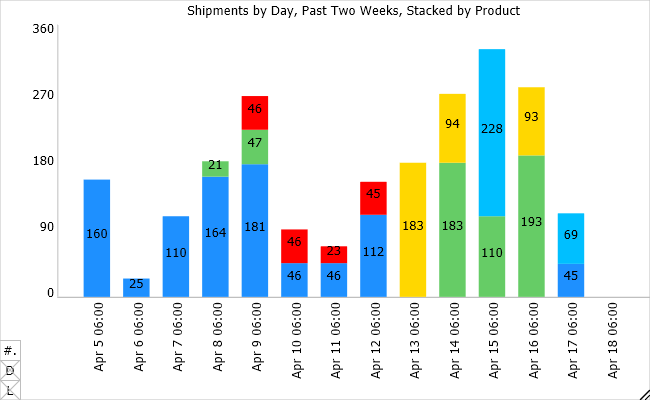
Shipments Stacked Trend Chart
View your recent shipments by day (or shift, or week, as you choose), stacked by whatever variable you choose. In this example, shipments are shown by day over a two-week period and stacked by product. You can view data values right on the chart, as shown, view them on top of the bars only, or leave them to display only in a corresponding data table. You decide.

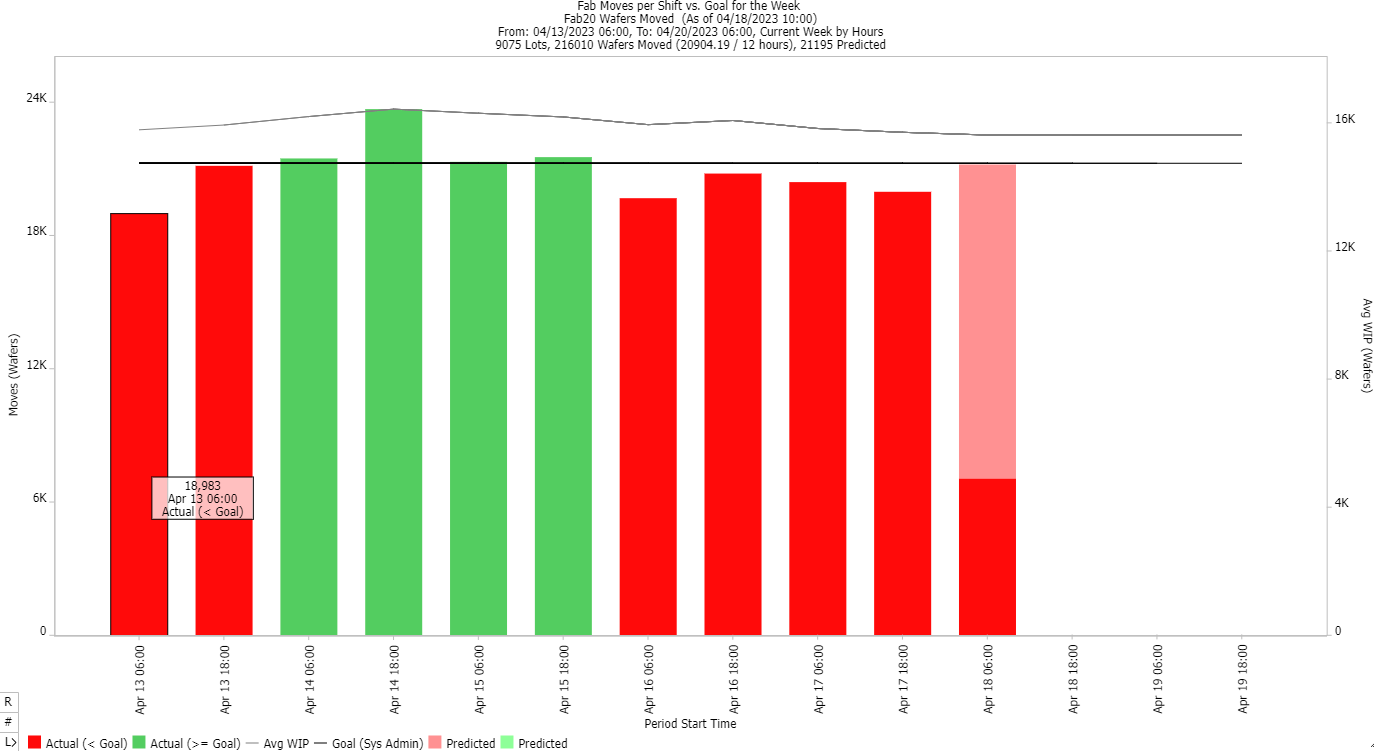
Moves Trend Chart
A core chart used in most wafer fabs is the Moves Trend Chart. This chart shows total fab moves by time period relative to a goal, as well as total WIP. You decide what time periods to use: hours, days, weeks, months, etc.
You can also filter this chart to:
- See a sub-set of moves and WIP
- View data for a particular production area or product type
- Exclude monitor wafers. Compare performance across shifts