Factory Operations Optimization
Cycle Time Analyzer
Understand Causes and Variation

Cycle Time Analyzer (CTA) and Enhanced Cycle Time (ETC)
There is no single metric more directly related to a factory's profitability than cycle time. INFICON cycle time analysis products leverage the extensive amount of historical data in the Digital Twin to create insight into cycle time metrics and losses. CTA and ETC provide detailed historical performance of a route, technology or lot and identify all operational inefficiencies from WIP with no operator, transit system delays, insufficient tools qualified when up, holds, etc. High-level summaries allow you to see the big picture and drill down to quickly to root cause.

Advantages
- Easy to navigate cycle time website available to anyone on the company intranet.
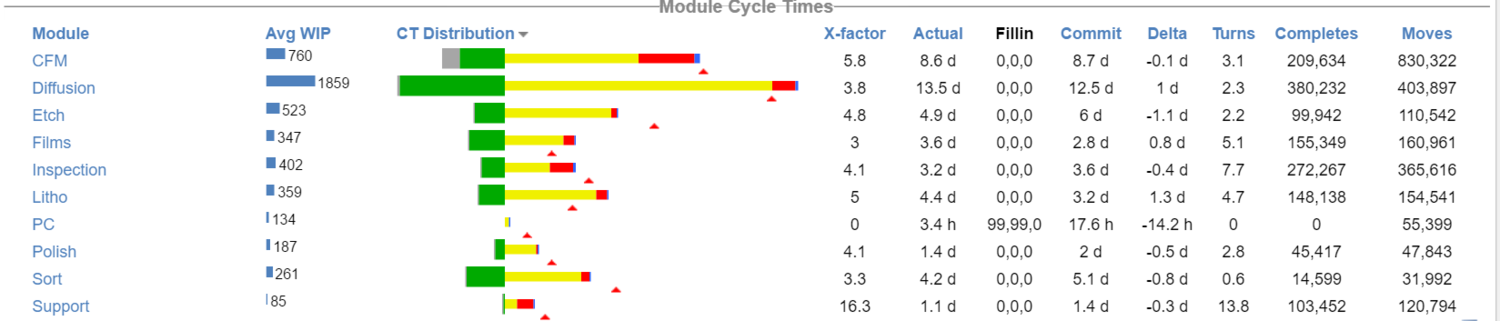
- The individual components of cycle time (queue time, process time, post process time) are broken down visually.
- Components of cycle time can be compared by product, by module, or by step within the product flow.
- Charts showing average WIP levels allow you to see the interactions between WIP and cycle time.
- Plan cycle time can be compared to actual data and edited directly from the site.
- Analysis supports multiple averaging windows to show cycle time trends
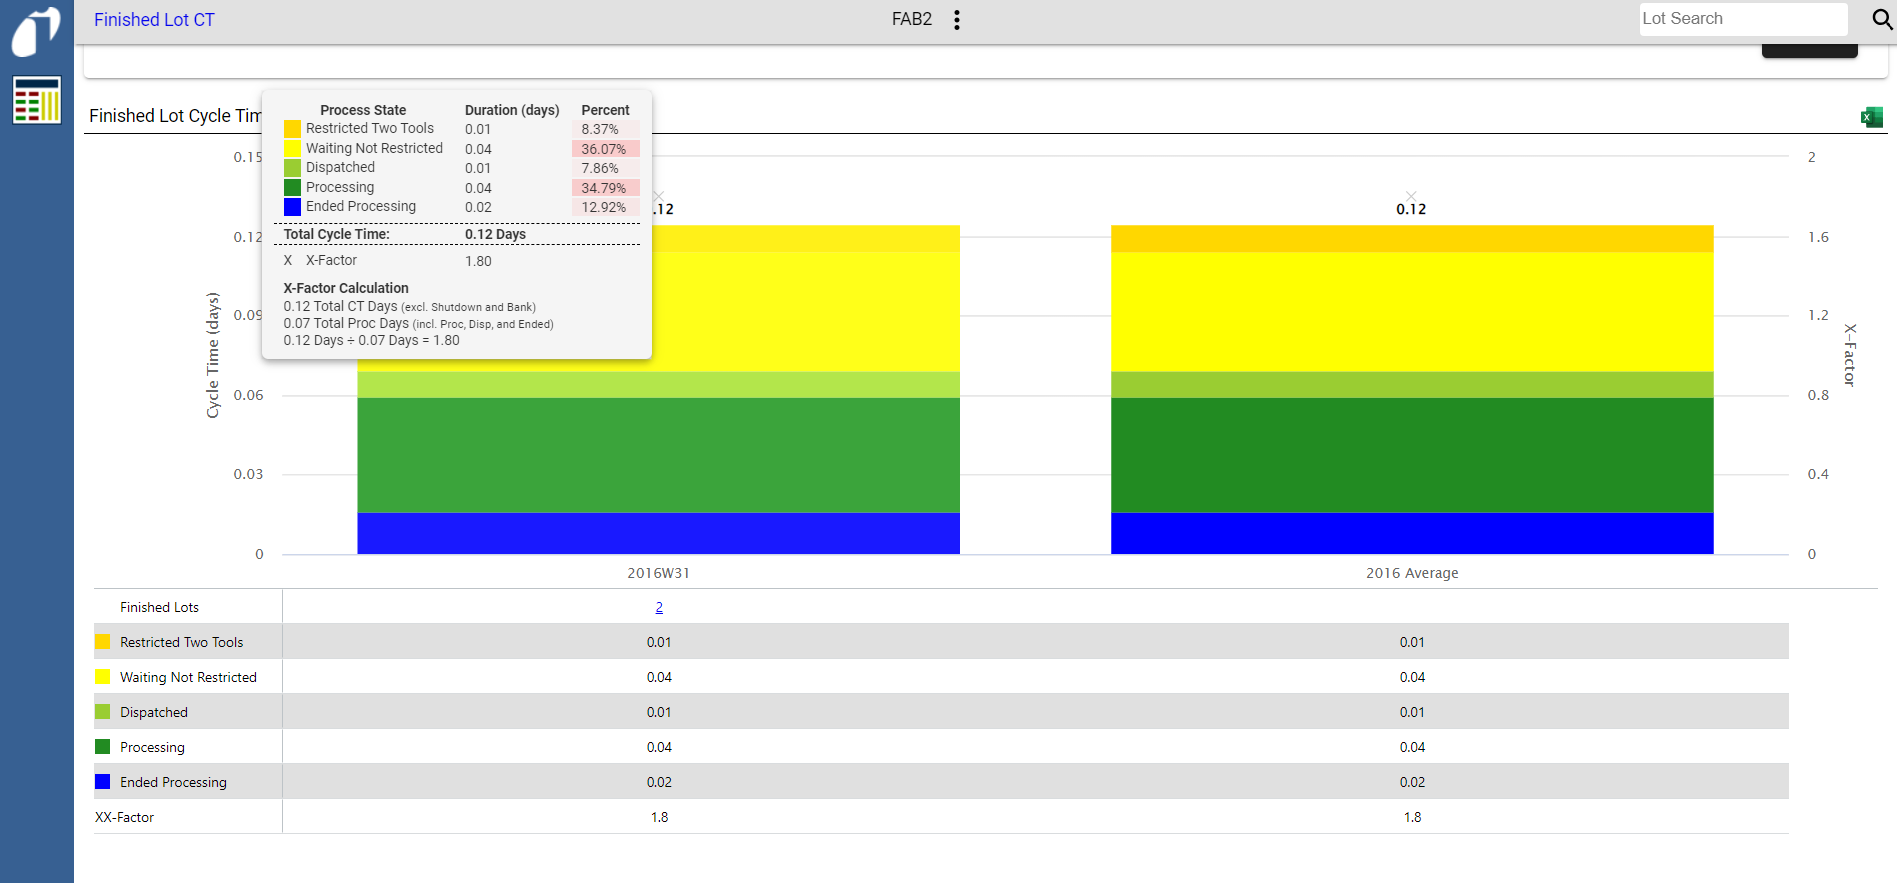
Finished Lot Cycle Time Analysis
In addition to dynamic analysis, Finished Lot CT analyzer allows you to drill down and investigate every lot that finishes in the Fab.

The software is used in the following markets


