What Do We Mean When We Refer to Tool Availability?
Seeking clear definitions of tool availability to meet the varied use cases of wafer fabs.
By Jennifer Robinson
In the previous newsletter, we talked about move definitions, and how different wafer fabs define moves differently. A metric that has long been part of the FabTime reporting software, and that has different possible definitions for different situations, is tool availability. In this article, we review four possibilities and provide clear naming and use cases.
What is Availability?
The SEMI E10 standard says that availability is “the probability that the equipment system will be in a condition to perform its intended function when required.” We can calculate this probability by taking “time that the equipment is in a condition to perform its expected function” and dividing by some measure of overall time.


There are two ways to think about the numerator, “time that the equipment is in good condition,” and two ways to think about the denominator, “overall time.” Each of these is consistent with the SEMI E10 tool states, which are shown below. We need to ask:


.")
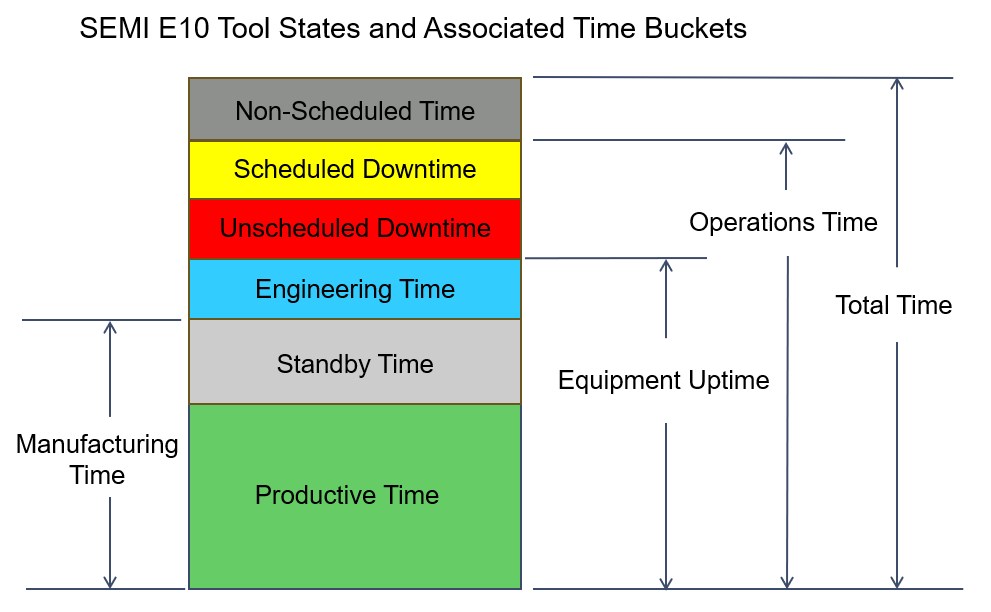
Let’s take the numerator first. We’re seeking the time interval that the equipment is in good condition to perform its intended function if required. We clearly want to include productive time (when the equipment is actually performing its intended function) and standby time (when the equipment is ready to be used if required).
But what about engineering time? From the equipment engineer’s perspective, if the tool is available to be used by manufacturing or process engineering, then it’s up. Therefore, from this perspective, engineering time should be included in equipment uptime. On the other hand, from the manufacturing supervisor’s perspective, if a process engineer is using the tool to run experiments, the tool is not available to be used by manufacturing. It would be helpful to have a version of availability (or something like availability) that focuses on when the tool is available to the manufacturing organization and does not include engineering time in the numerator.
Now let’s consider the denominator. The obvious denominator for availability is total time. How much time is the tool available for us out of total time? However, we need to think more carefully about non-scheduled time. What if we turn off a tool for a month during a downturn, setting its status to “non-scheduled time?” Should we (effectively) penalize the equipment engineers for that non-scheduled time, even if the decision to use non-scheduled time was made for business reasons? Or would it be better to use operations time (everything except for non-scheduled time)?
As we like to do at INFICON, we asked our customers these questions. (Thank you, Metrics Alignment Team members!) In the next two sections, we share what we learned from those discussions. Our proposed definitions follow.
Customer feedback: how should we treat engineering time in tool availability metrics?
In talking with our customers, we encountered two questions regarding the treatment of engineering time. The first was about when engineering time should be treated as downtime, and the second was about when engineering time should be considered available time. The first is answered by SEMI E10. The second is where we get into the need for two flavors of availability.
When should engineering time be treated as downtime? Some companies have different versions of engineering time. They ask: if this tool wasn’t being used for an engineering activity, would it have been usable by manufacturing? If not, then the engineering time is considered part of unavailable time. However, if the tool would have been usable, then that time is considered available time. The E10 specification clearly states that if the tool was not usable, then that time should be treated as downtime. E10 defines the engineering state as (emphasis mine):
“the equipment state when the equipment is in a condition to perform its intended function, but is operated to conduct engineering experiments, especially where the usage of the equipment system during ENG is not indicative of normal production. ENG includes any activities required to restore the equipment system to a condition where it may perform its intended function.”
Our recommendation, then, is to treat time that the tool couldn’t have been used by production, even if engineers were working on the tool in some way, as downtime. This is a good use of downtime sub-states. You could have a sub-state called “down-engineering” that is mapped to scheduled or unscheduled downtime, for example, and filter that time out for certain reports.
If it is engineering time (not downtime), when should it count as available time? If the tool could have been used by production but was used by engineers for experiments instead, that time should be treated as engineering time. This also covers the situation where engineers are using the tool to tweak recipes, doing recipe level quals.
Our customers broadly agreed that if the tool could otherwise have been used for production, then the maintenance organization would want to see the tool treated as available. But it’s also true that during that time, the tool was not available to the manufacturing organization.
We want a metric that includes engineering time as part of available time. This is time that the tool is not down and could be being used by production to run wafers. This is an appropriate metric to use for maintenance engineers, judging them on how well they keep the tool in a suitable state for running wafers.
However, we also want a way to capture the fact that sometimes, even though the tool is not down, it’s not available to manufacturing because engineers are using it for something else (experiments, recipe level quals, etc.). We can then measure the production organization based on how well they use the tool during the time that it is available to them.
Therefore, we conclude that we would like a version of availability with engineering in the numerator as well as a version of availability that only has production and standby time in the numerator.
Customer feedback: How should we treat non-scheduled time in availability metrics?
Traditionally, non-scheduled time is used for factory shutdowns and holidays that apply to most or all the tools in the fab. Tool-level non-scheduled time applies mostly to tools being installed, moved or decommissioned. Some fabs, however, especially during periods of slower business, put tools into a “soft idle” state. Soft (or intermittent) idle time is a non-scheduled state where the tool is ready to use except that it needs quals to bring it back online. A fab might bring a tool out of this soft idle state because another tool is going down for a long PM and then take it back out of production again in a few days. Some fabs also use this type of intermittent idle time due to temporary staffing issues or for savings on energy or consumables.
Some fabs use chamber-level non-scheduled time in the case of one chamber being inoperable, but production being unwilling or unable to take the whole tool down for repair. The chamber is marked “non-scheduled” so that the maintenance team is not penalized for not working on it. Other fabs instead use something like a “Prod Down” state, so that the chamber is recorded as down, but the maintenance team can see that production has requested them to wait on the repair.
More fabs appear to be using shorter-term non-scheduled states to indicate that a tool is unavailable but it’s not the maintenance team’s problem. Some fabs object philosophically to this, because the non-scheduled state can suggest that the tool isn’t going to be fixed at all. But in general, tools are in this soft idle state for management / business reasons, not because of anything to do with the maintenance team.
The increasing use of non-scheduled time to reflect tools and chambers being taken temporarily offline for financial or operational reasons has led to more fabs reporting availability relative to operational time (total time minus non-scheduled time). However, finance departments still typically want to see availability based on total time, to better understand overall effectiveness of the factory. Therefore, both measures (with and without non-scheduled time in the denominator) are helpful.
Our proposal for availability definitions going forward
We concluded from the discussion with our customers that there is at least an occasional need for each variant of numerator (with and without engineering time) and each variant of denominator (with and without non-scheduled time). Two choices for numerator times two choices for denominator give us four potential definitions for availability.
We define each of the four definitions relative to the SEMI E10 tool states shown above as well as the SEMI E79 Specification for Definition and Measurement of Equipment Productivity, with additional context on how these have been used in FabTime and/or the INFICON FPS product line.
- SEMI E79 Availability Efficiency (previously used on FabTime OEE charts) = SEMI E10 Total Uptime % = FPS Availability of Total Uptime = (Prod + Standby + Engineering) / Total Time. For simplicity and consistency with E10/E79, we propose calling this E79 Availability %.
- E10 Operational Uptime % = FPS Availability of Operational Uptime = (Prod + Standby + Engineering) / Operations Time, where Operations Time = Total Time – Non-Scheduled Time. We propose calling this Operational Availability %.
- FPS Available Manufacturing Uptime (AMU) = E79 Manufacturing Time/Operations Time = (Prod + Standby) / Operations Time. We propose calling this Operational Manufacturing %.
- E79 Manufacturing Time/Total Time = FabTime Availability (to manufacturing) = (Prod + Standby) / Total Time. We propose calling this E79 Manufacturing %. (Technically, E79 doesn’t define this as a percentage, but E79 and E10 clearly define “Prod + Standby” as “Manufacturing Time,” and we believe that taking a percentage based on Total Time is consistent with other E10/E79 calculations.)
The table below, prepared by my metrics team co-lead, Paul Campbell, makes these definitions clearer. Note the symmetry in naming within each row (based on the denominator) and column (based on the numerator).

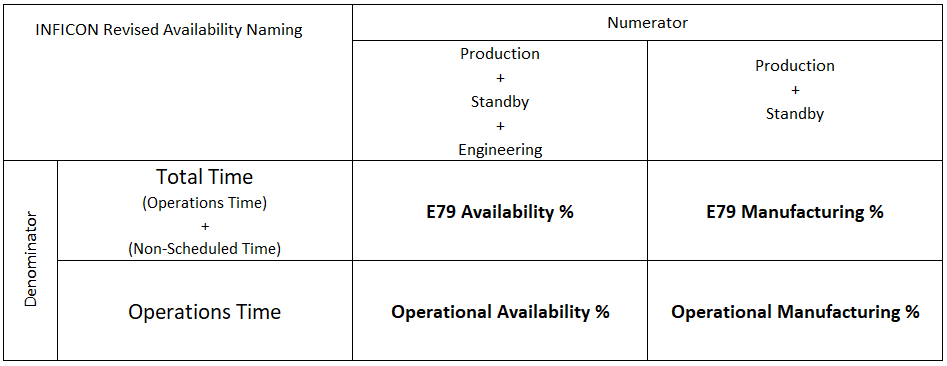
In this framework, recipe level quals should be included in the numerator of the left-hand column (Availability %) as Engineering time but would not be included in the numerator of the right-hand column (Manufacturing %). Thus Manufacturing % represents time the tool is in the hands of production (whether running wafers or in standby), while Availability % includes time that the tool was not available to production because it was being used by the engineers.
Similarly, the upper row is based on total time, while the lower row is based on operations time, excluding non-scheduled time.
Maintenance teams will likely prefer to use Operational Availability %. Manufacturing teams are more likely to focus on Operational Manufacturing % but might consider the E79 Manufacturing % to better comprehend opportunities to be had by re-activating tools. Meanwhile, E79 Availability % remains the most relevant of the four for improving overall equipment effectiveness.
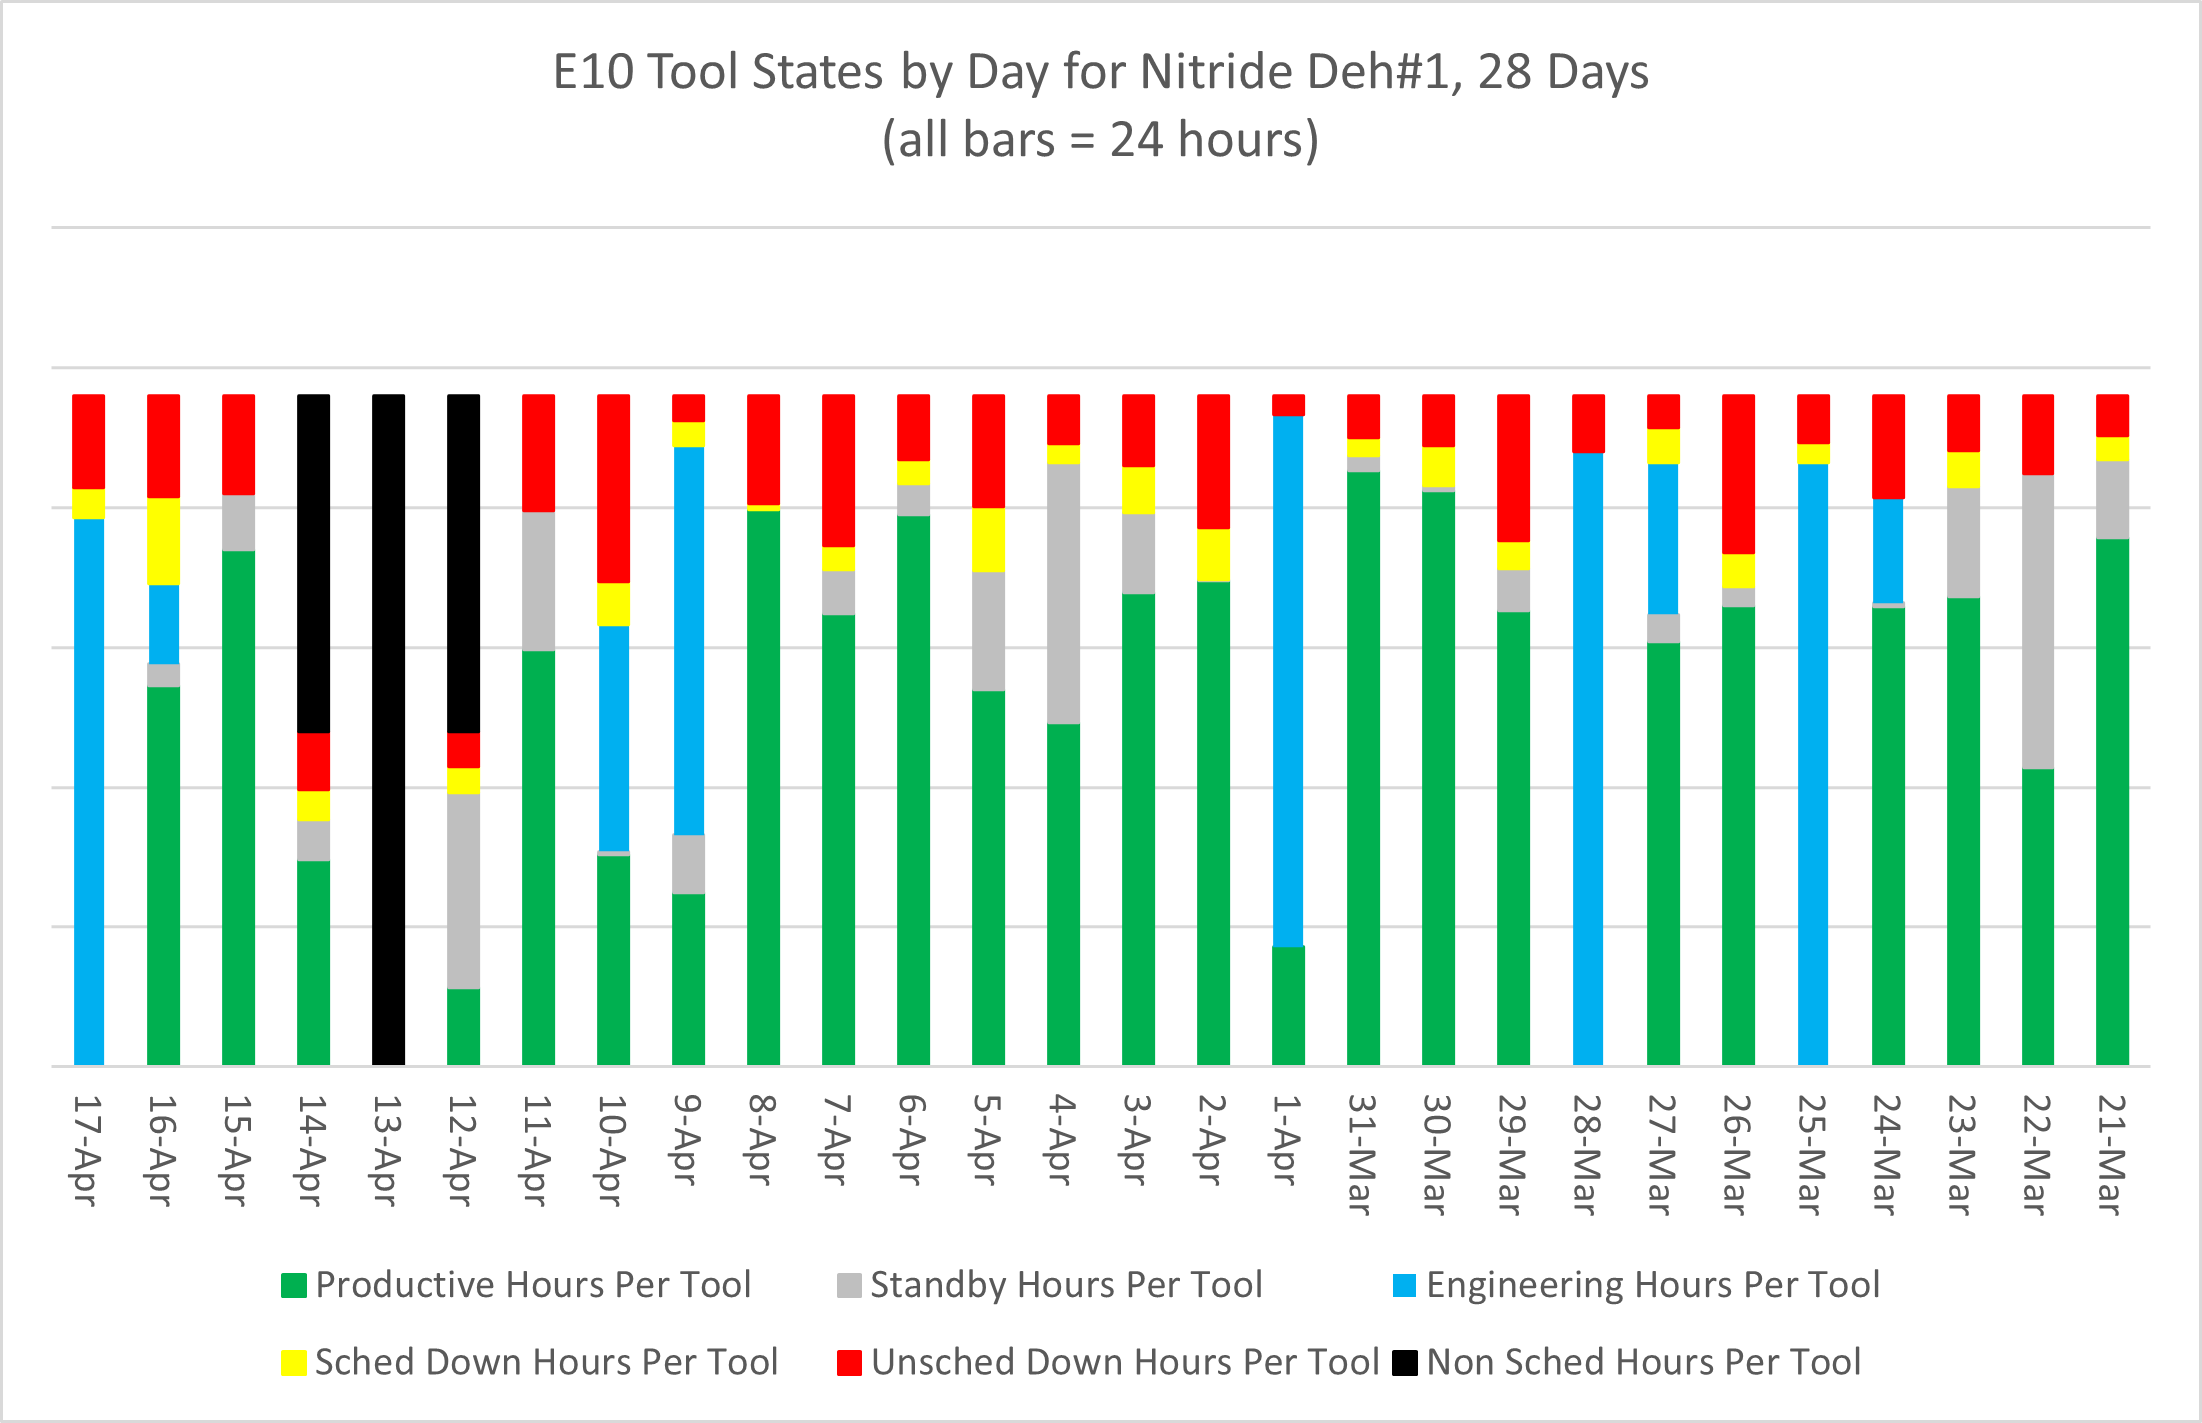
For example, consider the Tool State Trend chart below for a Nitride Deh tool. (This example is from our FabTime demo server, tweaked to add non-scheduled time.) This tool has significant intermittent chunks of engineering time. There’s also a single period of non-scheduled time lasting 48 hours that crosses three days.

The four different availability calculations for this tool are shown below. (Details are in a spreadsheet, available upon request from Jennifer.)

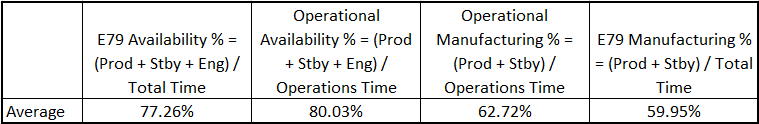
It will always be the case that in the presence of both engineering and non-scheduled time, Operational Availability % will be the largest of the four values, and E79 Manufacturing % will be the smallest. This is because the former includes engineering time in the numerator but does not include non-scheduled time in the denominator, and vice versa. The other two will vary depending on how much engineering time there is vs. non-scheduled time. If there is no engineering time or non-scheduled time, then all four values will be the same.
Which one should you use for calculating CV?
As has been discussed previously in this newsletter (see Issue 18.04: Measuring Variability of Availability and Issue 25.04: Improve Fab Cycle Time by Tracking the Right Equipment Reliability Metrics), in addition to striving to improve average availability, fabs should also work to minimize availability variability. One way to do this is to measure the coefficient of variation (CV) of the availability observations for a given tool or tool group, where CV = standard deviation / average. If we do this for each of the four availability definitions, then we have four flavors of CV of Availability:
- CV of E79 Availability %
- CV of Operational Availability %
- CV of Operational Manufacturing %
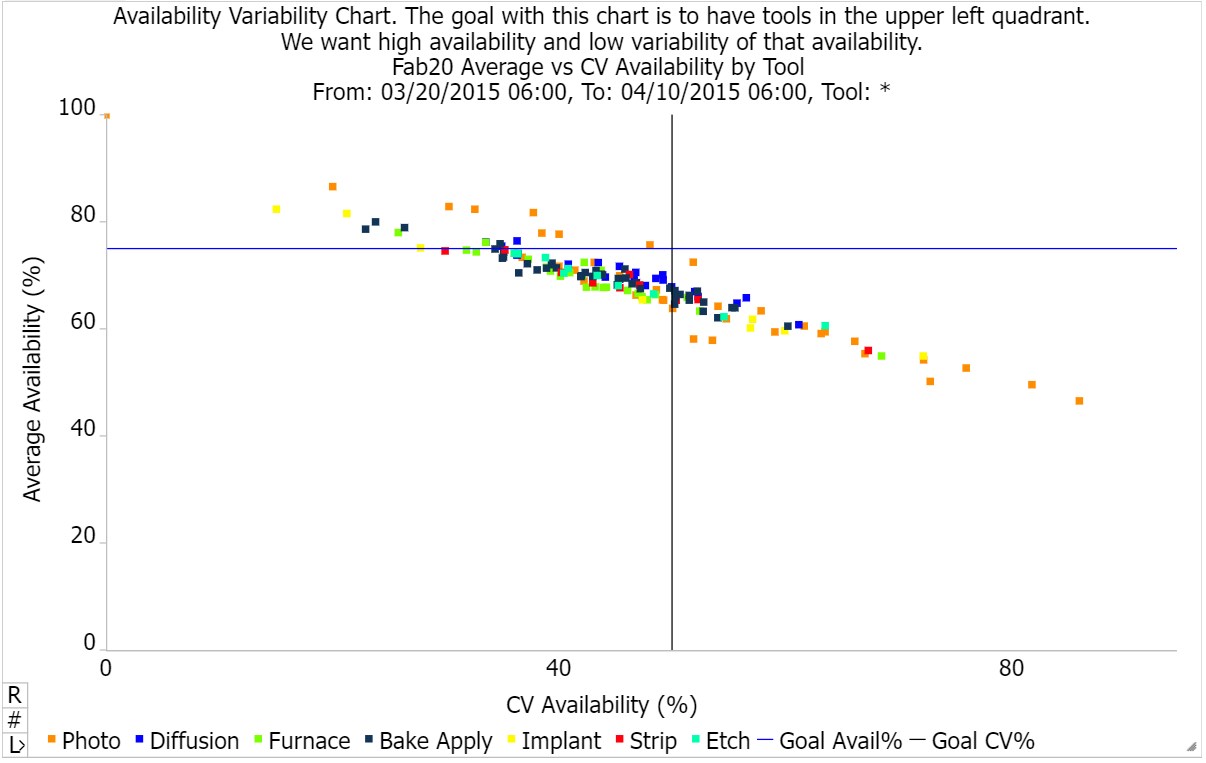
- CV of E79 Manufacturing % (This is the value that is currently used in the Average vs. CV of Availability chart in FabTime. An example of that chart is shown below.)

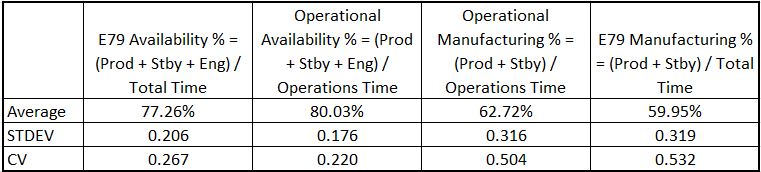
Continuing the previous Nitride Deh#1 example, there are 28 observations of each availability calculation. Standard deviation and averages of the availability values have been added to the table on the next page. What’s clear from this example is that there is less variation in the Availability % values (left two columns, which include engineering time in the numerator) than there is in the Manufacturing % values (right two columns, which only include time that the tool is available to manufacturing). This makes sense. Looking at the Tool State Trend chart above, we see that there isn’t a huge amount of day-to-day variation in the sum of scheduled and unscheduled downtime.

The intermittent engineering time creates considerable variability in the time that the tool is available to manufacturing. We see less variability impact due to the non-scheduled time because of course it doesn’t affect total time at all. On average, non-scheduled time in this example has a small impact on operations time (48 hours out of 672 = 7.1%). In a scenario with more frequent, shorter periods of non-scheduled time, we would expect a greater impact on the CV values. However, this type of usage of non-scheduled time seems less likely to occur.
INFICON recommends using the CV of Operational Availability out of the four possible choices. We want to use CV of Availability as a metric to encourage the maintenance team to keep the tools consistently available. Operational Availability % has “(Prod + Standby + Eng)” in the numerator, reflecting the maintenance organization’s success in making the tool available for production and engineering needs. Using operations time in the denominator reflects the fact that decisions about putting tools into temporary non-scheduled states are usually not made by the maintenance team. Therefore, they shouldn’t be penalized for the variability that stems from those decisions. We plan to make all four versions of CV of Availability/Manufacturing Time accessible in our reporting products.
Conclusions
Tool availability is something that people in fabs pay attention to every day. But, as with most things related to fabs, when we dig into the definition of availability, we find hidden complexity. After discussing availability with our customers, we identified a need for two different versions of the numerator for the availability calculation, and two different versions of the denominator. The variations in the numerator depend on whether time that a tool is up but being used by engineering (to perform experiments or recipe-level quals) counts as available time. The variations in the denominator depend on whether we use total time or operations time (which excludes non-scheduled time). These two versions of numerator and denominator result in four definitions, each of which may be relevant for different needs.
We intend to make all four definitions available in our products because we believe that people who run fabs should have access to the metrics that they choose. By calculating all four versions, and making the definitions clear, we will reduce confusion when comparing availability performance across fabs (or across tool sets within fabs). We’ll also calculate and display the corresponding coefficient of variation numbers for each availability metric. Here we do have a recommendation for which CV of availability value is most likely to help maintenance teams to drive variability reduction.
Acknowledgements
Many thanks to the members of our internal and customer metrics alignment teams, especially to my metrics team co-lead, Paul Campbell. Thanks also to the SEMI teams that developed E10 and E79, which have been invaluable in our discussions of tool states.
Further Reading
Past issues of the newsletter are available for subscribers to download in PDF format. Existing subscribers can find the archive link in your most recent email newsletter. New subscribers will see the link upon registering.
- Community Announcements included with this issue
- Subscriber discussion forum for Volume 26, No. 3
- Reach out to newsletter editor Jennifer Robinson here.


Want to learn more about cycle time drivers in your fab?
