Subscriber Discussion Forum:
FabTime Newsletter, Volume 26, No 3
We have subscriber discussion about estimating process time variability and understanding the impact of increased fab automation.

We have discussion this month about using the departure process to estimate the CV of effective process times for a tool, and about the impact of increased fab automation. If there is a topic you’ve been wondering about, please let us know.
Impact of increased automation on fab operations
A new subscriber wrote to Jennifer on LinkedIn to ask: “In your experience, how does automation change the way of working in Fab Operations – particularly regarding roles like operators, first-line support, shift leads, area team leads, and managers?”
Response from Jennifer: This is not something we’ve written about, but I think it’s an excellent topic for a future issue. In general, the more automation in the fab, the more necessary (and feasible) it is for a fab to implement a scheduling system. Then, once there is a scheduler in place, front-line manufacturing personnel start to rely more on the scheduler and less on individuals making their own decisions.
This evolution is happening in fabs across the industry and will accelerate with the advent of AI solutions. As fabs become ever smarter, more decision-making will be automated, and fewer levels of management will be needed. What will remain needed, however, are people to tune the computer systems to make sure they are working properly, and people who can physically repair tools when there are problems. Of course, there will be a lot that current managers and operators will continue to do during the transition. None of this is going to happen overnight.
I’m opening up this question to other subscribers, as I’m sure we have readers who have been through and are going through this transition. If enough people share their stories, I’ll work on writing them up for a future article. Thanks for asking a great question!
Using the CV of the departure process from a tool to estimate process time variability
A long-time subscriber wrote: “At my company, we are challenged with cycle time for development process flows that have many single thread tools and engineering holds. Many subgroups are working on various things. My subgroup is looking at ‘lost revenue due to down one-of-a-kind tools.’ So, if a lot is held up at a tool, the lot can’t move through the next 2/3/4 steps either. Because our customers pay us for wafer/step movements, our revenue flows experience a time delay vs. having no down tools.
We are trying to use queueing formulas to estimate the cycle time impact. We are going to set the arrival coefficient of variation (CV) of lots going into the tool to be one, as we don’t have the capability of calculating that more accurately due to myriad input paths. But we need a way to estimate the CV of the sequence of process times on the tool. What we’re trying to do is use the time between lots leaving the tool to get an estimate of the CV of the process times.
If the exit times of 100 individual lots are known (all different times coming out of the tool), is there a way to pull from an equation or table what would be the CV? We know that the lot-to-lot time is a distribution, but we haven’t found a way to turn that into an actual CV number.”
Response from Jennifer: It seems valid to me to use the departure process as a proxy for the CV of the process times for tools that are heavily loaded. If you try to do this for lightly loaded tools, you’ll end up with a considerable (and varying) amount of idle time in the measurements of times between departures, and you will likely overestimate the process time variability. The other thing about using the departure process, as I’m sure you understand, is that you’ll be capturing the CV of the effective process time, where you are treating any unavailable time or setup time as part of the effective process time of the next lot that is processed. Effective process times are hard to calculate from move ins (you have to keep track of which lot was at the front of the queue when a setup or downtime occurred, but you can have other lots that arrive and preempt that lot, so the calculations are fairly complex). This means that looking at the departure process is a reasonable idea for capturing process time variability, at least for heavily loaded tools.
I looked at a couple of examples of this from our FabTime demo server. CoatA#4 is a very low utilization tool (~54%) while IonHigh#4 is a high utilization tool (near 100%) that has poor uptime. The Gantt chart below shows the tool states over a week for each tool.

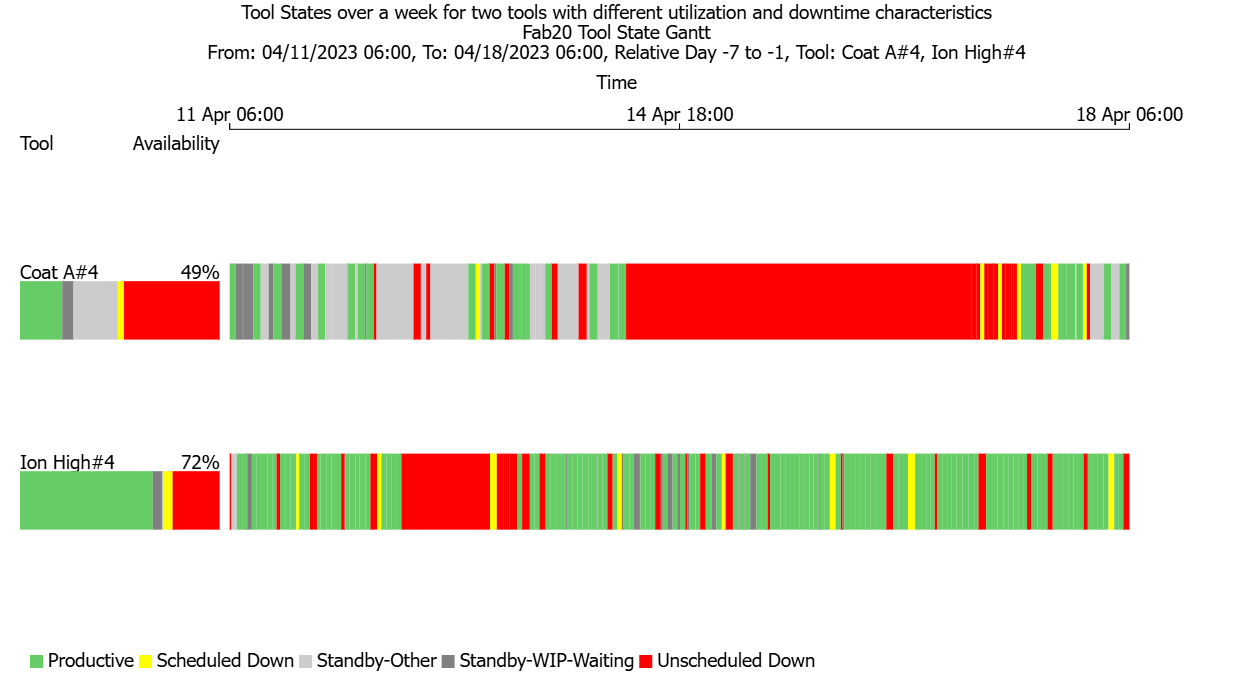
Using a spreadsheet, I looked at the sequence of process times for each tool and calculated the CV of the time between departures and the CV of the sequence of actual process times (note these are actual process times, not effective process times). Those values are quite different, as shown.
 of departure process vs. CV of sequence of process times for two different tools")
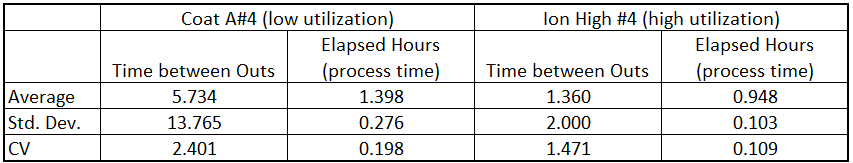
What I think is that the CV values in the first column for each tool, which represent the departure process/effective process times, do look more realistic in terms of capturing the variability of the system, especially for the higher utilization Ion Implanter. The question is what to do for the lower utilization tool, where the CV estimate is inflated by the instances of idle time on the Coat tool (the gray bars in the above Gantt chart). Does anyone have ideas on this?
We welcome the opportunity to publish subscriber discussion questions. Submit responses here.
Past issues of the newsletter are available for subscribers to download in PDF format. Existing subscribers can find the archive link in your most recent email newsletter. New subscribers will see the link upon registering.
- Main article for Volume 26, No. 3: What do we mean when we refer to tool availability?
- Community Announcements page for Volume 26, No. 3


Want to learn more about cycle time drivers in your fab?
