Setup Time, Tool Qualification, and Cycle Time
How does setup time affect the CT benefits of qualifying a second tool?

By Jennifer Robinson
One of the top recommendations we’ve made in this newsletter (see Issue 20.05, for example), and in our cycle time management course, is for fabs to move from one qualified tool to two wherever possible. We’ve demonstrated that qualifying a second tool decreases average cycle time per visit by approximately 50% (with smaller decreases as we go to three qualified tools, four qualified tools, etc.). The intuitive explanation for this is that whenever lots are waiting in queue for a single path operation, they are subject to all variability associated with the tool in question, including long unplanned downtimes. When there is a backup tool, the odds of both tools having a long adverse event that holds up the lot are much smaller.
However, nearly every time I present this result, someone in the audience says something like: “Sure, but what about the extra setup time if we have two cross-qualified tools vs. two dedicated tools?”
Here I usually point to the graph below and note that even if we lose some utilization to having to do extra setups, we’re still better off being on the green curve at a higher utilization than. being on the red curve. If we wanted to constrain the cycle time per visit to 4X, we’d have to keep the utilization to ~72% on the red (fully dedicated) curve. But if we could move to the green curve, we could increase utilization to ~84% and achieve the same 4X cycle time. We could do quite a few extra quals within that 12% difference.

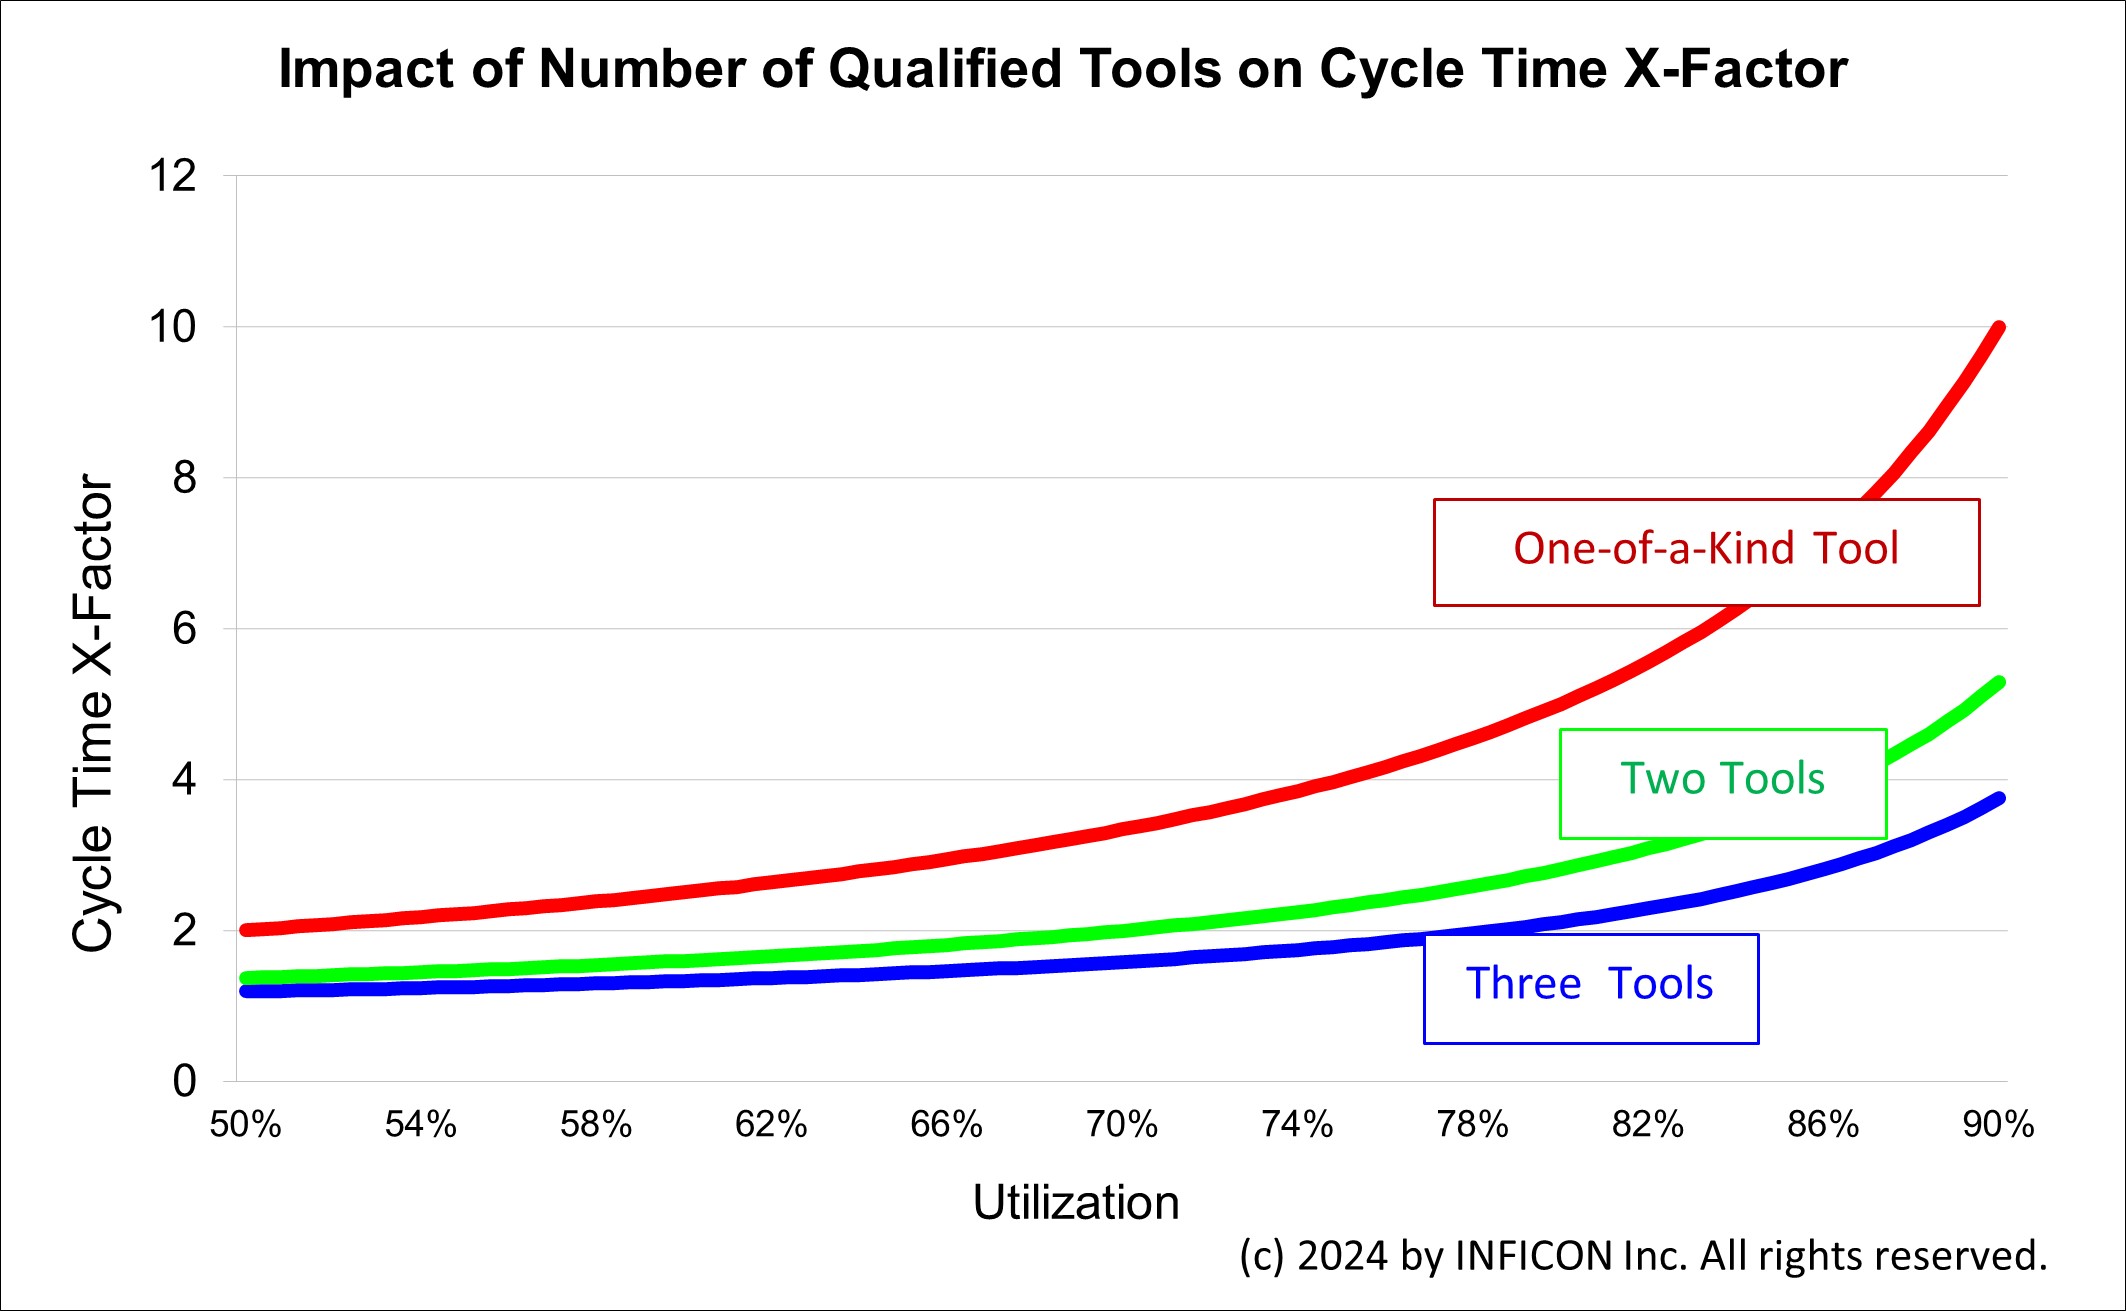
This explanation makes intuitive sense, but it’s a bit tricky to visualize when looking at the graph. I decided it was high time I created a graphic to show the positive impact of qualifying a second tool even if that cross-qualification requires some additional setup time. What I discovered was that the outcome is sensitive to the quantity of additional setup time (of course) and where we are on the utilization curve to begin with.
How the operating curve spreadsheet works, and why we can’t just add some extra downtime to one scenario to represent extra setup time
The graph above was created using the FabTime Operating Curve Generator, available for download from INFICON’s website. Users can enter values for up to three scenarios. The spreadsheet uses queueing models to generate the resulting operating curves. Inputs include number of tools, percent downtime, and arrival, processing and downtime variability measures. One input that doesn’t make sense to vary across scenarios is percent downtime. This is because utilization is defined relative to available time. Changing percent downtime between scenarios would require the different scenarios to be on different x-axis scales, with different definitions of 100% utilization.
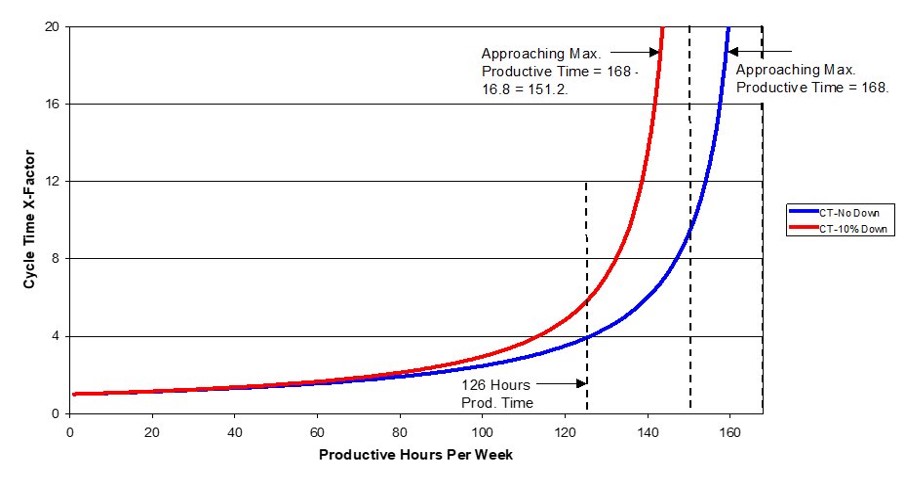
For example, the graph below (from Issue 25.04) shows an operating curve with no downtime (the blue graph) compared to one with 10% downtime (the red graph). We can’t put “Utilization” on the x-axis, because these scenarios have different utilization values at the same number of productive hours per week. The shorter dashed line is shown at 126 hours of productive time. For the blue graph, this is 126/168 = .75, or 75% utilization. For the red graph, where the maximum productive time is only 151.2 hours, the utilization at 126 hours is 126/151.2 = 83.3%.
This means that I couldn’t just compare, say, 1 dedicated tool at 20% downtime with 2 cross-qualified tools at 25% downtime, with the extra 5% representing setup time. I had to do more of a work-around.

What I did instead to put two different scenarios (one with two dedicated tools and one with two cross-qualified tools and 5% of total time spent doing extra quals) on one graph
Here’s what I did:
Used the operating curve spreadsheet to generate the operating curve for a single tool with 20% downtime (33.6 hours/week) and moderate variability. This is the base scenario for full dedication, when there is only one tool per recipe.
- Converted the utilization values for that operating curve into productive hours/week for each point on the curve.
- Calculated a revised standby time at each point if 8.4 hours/week (5%) qual time was taken out of standby time. (168 hours– 33.6 hours of downtime – 8.4 hours of qual time – productive hours)
- Calculated a revised utilization % based on the original productive hours and the revised standby hours. (Productive / (Productive + Revised Standby)
- Filled in the revised utilization numbers in the operating curve calculations for a scenario with two tools (cross-qualified case), using the same 20% downtime and other variability values.
- Graphed productive hours vs. cycle time x-factor for the two scenarios onto the same graph in Excel.
What the results look like at low to moderate utilization
Here’s the resulting graph, up to the equivalent of 85% utilization for the dedicated case. Note there is 20% downtime in both cases (MTBF = 24 hours, Cr = 1.0). The maximum productive hours = 168 – 33.6 = 134.4. The right-most point shown on the graph is 114/134.4 ~= 85% for the red curve.
On this graph, the average cycle time reduction from the red curve (full dedication) to the blue curve (cross-qualification with 2 tools, 5% qual time) is ~33%. This reduction ranges from about 37% at low utilization down to ~12% at 85% utilization.


What happens when we push the utilization higher, closer to 100%?
Here’s what happens when we push the utilization a bit higher, to 122 productive hours/week. This works out to 90.8% utilization for the red curve. For the blue curve, with 8.4 fewer available hours per week, the utilization at 122 productive hours = 122/(134.4 – 8.4) = 122/126 = 96.8%. Because the blue curve has a higher utilization for the same number of productive hours, we reach the steep part of the operating curve sooner and more dramatically. The curves cross, as shown.


Comparing these results to the prior “50% reduction from qualifying a second tool” framework, with some sensitivity analysis
With no extra setup/qual time, the cycle time x-factor for the cross-qualified case (with a backup tool) is approximately 50% lower than for the dedicated case (only one tool per recipe). When we include 5% setup time (8.4 hours/week), the cycle time improvement from adding a second tool drops to ~33%. This improvement only applies up to ~85% utilization for the dedicated (red) curve. Above that, the extra setup time takes the blue (cross-qualified) graph into the steep part of the operating curve. We see worse performance for the cross-qualified system due to the dominant effect of utilization.
Bottom Line: Going from one qualified tool to two is still helpful for reducing cycle time, even in the presence of additional setup time, at least at low to moderate utilizations. Once we get to the steep part of the operating curve, the impact of the extra qual time on the utilization outweighs the benefits of the redundancy (the curves cross).
Exact results will, of course, depend on how much variability is present. I looked at adding more downtime variability (changing the coefficient of variation of repair time to a higher value). In that situation, the red and blue curves moved a bit further apart at the lower end, showing closer to a 40% reduction in cycle time going from the dedicated to the cross-qualified case. But the curves (not shown here) still crossed at a similar utilization.
I also looked at a scenario with 10% setup time instead of 5%. The red curve (dedicated case) was still higher than the blue curve by about 33% (e.g. 4x vs. 3x at the same number of productive hours) at lower utilizations. However, the curves crossed sooner (at about 103 vs. 119 productive hours). That graph is shown below.
I also considered modeling setup time that varies according to the utilization. However, it wasn’t clear to me what form that variation should take. Nor did this seem likely to have a significant impact on the results.


One other point about the dedicated case is that this analysis implicitly assumes that flows are dedicated equally to tools. That is, we are effectively considering two equal volume recipes. In the dedicated case, we assign each recipe to a different tool. In the cross-qualified case either recipe can be run on either tool (hence the need for additional setup/qual time). In practice, it’s unlikely that actual production volumes will be so equally balanced. Instead of two tools each at 85% utilization, you might end up with one tool at 75% and one at 95%. Cycle time will be significantly worse in the latter case, because of the nonlinear operating curve. This is another argument that cross-qualification is likely to be better than dedication for cycle time performance.
Conclusions
This newsletter and accompanying cycle time improvement course have stated many times that a top recommendation for improving fab cycle time is, where possible, to qualify a second tool. Where additional setups are not an issue, qualifying a second tool results in a roughly 50% reduction in cycle time per visit. Fabs that are cycle time focused (e.g. foundries) tend to have policies that require at least two qualified tools per recipe before a new flow is released to production.
This article presents a more nuanced view of the benefits of cross-qualification in the presence of setups. Even when there are setups, it’s usually still worthwhile to qualify that second tool, especially when your tools have high availability or process time variability. There may be cases where the setup time is very long and/or the tools in question are already at a high utilization. In those cases, tools may not be able to absorb those extra setups without paying a significant cycle time penalty. Where this occurs, dedication may still be necessary.
In most cases, the benefits of qualifying a second tool remain strong. Having a backup tool provides an alternative path that keeps lots moving in the presence of variability (from down tools, long process times, etc.) and lowers average cycle time as well as cycle time variability.
Closing Questions for Subscribers
Does your fab require a second qualified tool for each recipe when releasing new flows to production? Have you found real-world scenarios where cross-qualification hurts cycle time, by depleting your standby time buffer too much?
Further Resources
All past FabTime newsletters are available in PDF format from the FabTime Newsletter Archive. Please reach out to me for the link or look in the most recent email issue of the newsletter. You can download individual issues or download a zip file containing all past issues. Some articles have been re-published on the INFICON website. Those are linked above where mentioned.
For a more in-depth discussion of how these choices apply to your site, consider hosting a session of our four-hour web-based cycle time management course.
Further reading from this issue: